Lecture 1 Video 11 Ramachandran Plot Guide
🧬 Ramachandran Plot — A Visual Guide to Peptide Structure


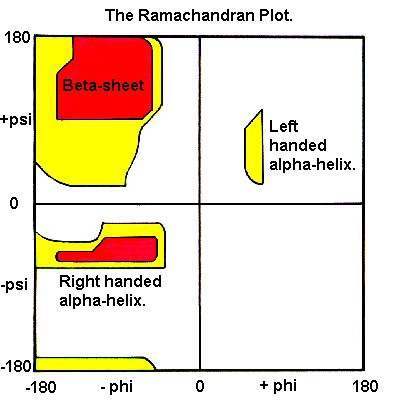

This file explains what the Ramachandran plot is, how to read it, and why it directly reflects the physical reality of peptide structures . Below is a complete, structured, and study-friendly walkthrough of all concepts covered, with emphasis on geometry, energy, hydrogen bonding, and steric clashes.
1️⃣ What the Ramachandran Plot Shows
The Ramachandran plot maps the backbone dihedral angles of a peptide:
- φ (phi) → rotation around the N–Cα bond
- ψ (psi) → rotation around the Cα–C bond
Each point on the plot corresponds to one specific peptide backbone conformation.
Key idea: 👉 Not all φ/ψ combinations are physically possible.
2️⃣ An Energy Landscape, Not Just a Plot
The plot is best understood as an energy landscape:
| Color | Meaning |
|---|---|
| Dark blue | Most favorable (lowest energy) |
| Cyan | Allowed |
| Gray | Generously allowed |
| White | Forbidden (steric clashes) |
- Favorable regions = low energy + good hydrogen bonding
- Forbidden regions = high energy + steric clashes
3️⃣ Periodicity of the Plot (±180°)
- Angles of +180° and −180° are equivalent
- The Ramachandran plot is periodic
- Structures at the edges wrap around seamlessly
This explains why:
- A structure at (−180°, −180°) is the same as (+180°, +180°)
4️⃣ Following Structure Changes Across the Plot
The animation described in the file tracks a red arrow moving across the plot, while showing two identical peptide models:
Upper structure
- Displays hydrogen bonds (yellow dotted lines)
Lower structure
- Displays steric clashes
- Blue → mild
- Red/purple → severe (unacceptable)
Interpretation rule:
- ✔ Favorable → hydrogen bonds, no clashes
- ❌ Forbidden → severe steric overlap, no stabilizing bonds
5️⃣ Extended Conformation → β-Strands & β-Sheets
- φ ≈ −180°, ψ ≈ −180°
- Structure is fully extended
- Not the most favorable, but still allowed
This region corresponds to:
- β-strands
- β-sheets
Why allowed?
- Minimal steric clashes
- Compatible with inter-strand hydrogen bonding in sheets
6️⃣ Entering Forbidden Regions (Positive φ)
As φ becomes positive:
- Backbone begins to coil
- Atoms approach each other too closely
- Steric clashes appear and worsen
- Blue → red → purple clash indicators
Result: ❌ Physically impossible conformations
7️⃣ The 3₁₀ Helix (Less Favored but Real)
Between β-regions and α-helix lies a smaller, less favored region:
Characteristics:
- Some steric clashes
- Hydrogen bonds still present
- Structure is a 3₁₀ helix
Why “3₁₀”?
- 3 residues per turn
- 10-atom hydrogen-bonded ring
📌 Typically:
- Only one turn long
- Common as helix caps or transitions
8️⃣ The α-Helix — The Star of the Plot 🌟
Moving further:
- φ ≈ −60°, ψ ≈ −45°
- Strongly favored region
Properties:
- 3.6 amino acids per turn
- Optimal hydrogen bonding
- Minimal steric clashes
This is: ✅ One of the most common secondary structures in proteins
9️⃣ φ = 0° → Planar & Forbidden
At φ ≈ 0°:
- Backbone becomes planar
- Severe steric clashes occur
- No hydrogen bonds to compensate
Result: ❌ Highly unfavorable and forbidden
🔟 Left-Handed α-Helix (Rare but Allowed)
There is a small favored region with positive φ:
- Corresponds to a left-handed α-helix
Characteristics:
- Allowed
- Energetically less favorable
- Usually no more than one turn
Why rare?
- Most amino acids are L-amino acids
- Geometry disfavors left-handed helices
🧠 Big Picture Summary
The Ramachandran plot shows that:
- Protein structure is constrained by physics
- Steric clashes forbid most conformations
- Secondary structures emerge naturally from allowed φ/ψ space
- Hydrogen bonding explains why some regions are favored
Mental model to remember:
🗺️ The Ramachandran plot is a map of where a peptide backbone can safely exist.